Widget Properties (Tutorial)
The following exercise assumes that you have completed all the tutorial lessons prior to this in the menu. If so, ignore this note and continue.
If not, you can still do this exercise. Load the Training Simulator, as described in Add Applications (Tutorial). Navigate to the Sample Pages >> Demo Page and follow the instructions there to enable the Demo System tags. You will need to make adjustments in the exercise steps since the path to the tags won't be the same, and the Demo System has been built to a state that may not match that of the previous chapter in this tutorial.
The widgets drawn so far are very basic. Much can be done to improve the screen.
Style Settings and HP/HMI
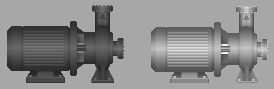
We'll start with the equipment image, showing the state of the pump. Note that it changes from dark gray to light green as the pump cycles off and on.
Under standard HP/HMI (high performance/human machine interface) design, the shade for "On" should be white or a pale gray. For the equipment widgets, that's controlled by the Style Settings tag. Therefore, we'll start by adjusting tag properties rather than widget properties.
- Open the Tag Browser.
- Navigate to the top (\) level.
- Ensure that the filter, Show Children is not selected.
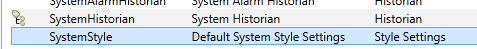
- In the main window, locate and select the SystemStyle tag.
- Open its properties dialog.
- Select the Digitals tab.
- For the second property, Value == 1, select the Color button.
The Select Color dialog opens. - Select the lightest shade of gray available.
- Select OK to close the dialog.
- Back in the Style Settings properties dialog, select OK again to close that dialog.
- Close the Tag Browser.
With this system of using light and dark gray to represent the state of equipment, some find that it's easier to tell the difference between the shades if the page background is a medium gray. "Lighter than the background" / "darker than the background" is easier than "which shade of gray is that?"
- Open the Idea Studio.
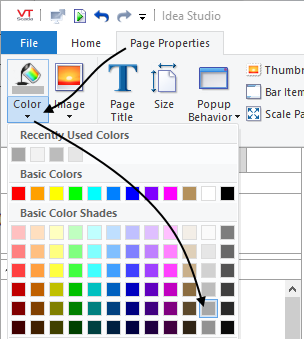
- Select the Page Properties ribbon.
- Select the Color tool within that ribbon.
- Select a medium shade of gray, as shown:
Do not close the Idea Studio yet. There's more to do. But, you should now find it much easier to tell whether the pump is running if you use gray scale instead of green / gray. If not, try adjusting the page color and the style settings to increase the difference.
Adjust the Vertical Analog Bar
The vertical bar that represents the Level is showing only a fraction of the information available to it. In the next set of steps you'll explore what else it can do.
- Working in the Idea Studio, right-click on the Vertical Bar to open the pop-up menu.
- Select Properties.
(Did the I/O and Calculations tag's Properties dialog just open? If so, you're working in the operator-view of the page, not the Idea Studio. Close that, open the Idea Studio and start again.)
This is a large properties dialog. You may need to stretch it to see all the tools.
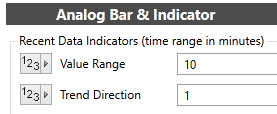
- Note the property for Recent Data Indicator -> Value Range.
- Set the value to 10.
- Click OK to close the properties dialog.
There should now be a dark blue bar on the widget, indicating values recorded over the last 10 minutes - Reopen the properties dialog and set the Trend Direction value to 1. (Measured in minutes)
- Select OK to close the dialog.
An arrow, pointing up or down, now indicates the trend direction of the Level, relative to the value recorded one minute ago, and updating every five seconds.
For the next improvement to the widget, you will need to change a property in the tag.
- Close the Idea Studio.
- In the Overview page, right-click on the Vertical Analog Bar to open the pop-up menu.
- Select Properties.
This time, the tag's properties dialog should open. If you're looking at the widget's properties menu, close that and start again. - Select the Scaling tab.
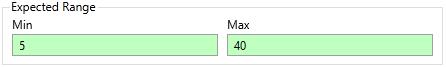
The last of the four scaling properties is Expected Range. - Set the minimum expected range to 5 and the maximum to 40.
- Select OK to close the properties dialog.
There should be a pale blue band on the widget, indicating the expected range of values. How do the values recorded over the past 20 minutes compare to the expected?
Just as the colors for the digital Equipment widget were controlled by the Style Settings tag, so are the shades of blue you see now. Feel free to experiment.
The widget can also indicate the alarm setpoints and whether or not there's an active alarm. But since you have not yet configured an alarm, that will have to wait for a future lesson.
Keep Exploring
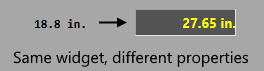
There's still much to learn about Display Building (Idea Studio). You'll see more tags and more ways to draw them in later chapters of this tutorial, but in the meantime, go exploring. For example, can you find a way to change the properties of the Numeric Value Widget you drew earlier to make it look like this?
Ready to continue? Open Write I/O (Tutorial)
