Source Debugger Components

Source Debugger
The first part of the Source Debugger to learn is the toolbar. A keyboard shortcut is available for many of the tools. Hover over each for a tooltip describing the tool and the keyboard shortcut, if any.
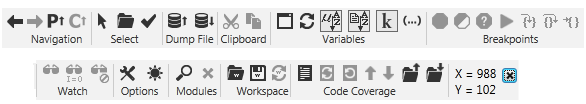
Source Debugger Toolbar
Listing the buttons from left to right, by group.
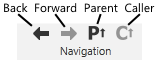
Back Button & Forward Button
Use these two buttons to move back and forth through the modules you have recently viewed. You may also use the keyboard combinations Alt + Left Arrow (move left) and Alt + Right Arrow(move right) to step through the modules.
Parent Button / Caller Button
Click to open the parent or the caller of the currently selected module.
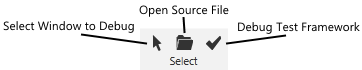
Select Window to Debug Button
Select this tool then click on any open VTScada window. Automatically selects the matching module in the Module Tree and opens that module in the Module Content List window.
Note that this may navigate to the module that owns the window rather than the module that provides the content for that window. For example, if you were debugging the Completed Tutorial, had opened the Overview page as a pop-up, then used this tool to select that page, the module would be DisplayManager >> Session >> Graphics. Within the module content list for that, you would find a link to the Overview page's module.
Open Source File Button
Click to browse for and open any VTScada source code file (*.SRC). Any file may be opened but breakpoints can be set and values read only for running applications.
Debug Test Framework Button
Launches the Test Framework application to run pre-written tests on the selected module.
See: Test Framework Application
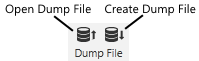
A dump file is a snapshot of all the information that would be available for an application if you were viewing it live in the Source Debugger. A dump file is typically created to be sent to Trihedral Technical Support for analysis of a problem.
See: Dump Files, Dump Files

You can copy and paste values in the Module Content List window. All VTScada data types can be copied. Behavior when pasting may vary depending the type of data held by the selected item and on whether you have simply selected the item, or clicked twice on the item to enter edit mode.
If you highlight and then single left-click a variable to enter edit mode, the value on the clipboard will be pasted into the edit field as a text representation of the copied quantity (e.g. the name of an object is pasted, rather than an object value). The text representation of the value is also available to applications outside the Source Debugger and to processes outside VTScada.
Not all VTScada values can be represented as text. For those that cannot, the text "Valid" or "Invalid" will be pasted.
If you select an item in this window and paste without entering edit mode, then if the clipboard holds a data type that can be pasted into the selected item, it will be.
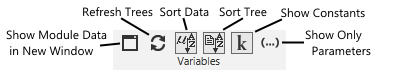
Show Module Data in New Window Button
Click to launch a new window displaying the objects associated with the selected module.
Refresh Trees Button
Refresh the module trees, ensuring that any new module instances that have been added are displayed.
See:
Sort Data Button
Sort the contents of the module content window in ascending alphabetic order.
Sort Tree Button
Sort the contents of the module tree in ascending alphabetic order.
Hide Constants Button
Hide constants that would otherwise be displayed in the module content window.
Show Only Parameters Button
Display only parameters for the selected module in the module content window.
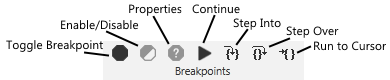
Toggle Breakpoint (F9) Button
Set a breakpoint in the code you are viewing. A breakpoint indicates to the Source Debugger that the selected application should pause execution at a certain point.
See: Breakpoints and Data Breakpoints
Enable/Disable Breakpoint (Ctrl + F9) Button
Disable an existing breakpoint or enable a disabled breakpoint in the code you are debugging or examining.
Breakpoint Properties (Alt + F9) Button
Open a window within which conditional breakpoints can be configured.
Continue (F5) Button
Continue execution of the code you are debugging or examining when a breakpoint has been hit and code execution paused.
Step Into (F11) Button
The Step Into button steps you into a statement, even if it is in another source file.
See:
Step Over (F10) Button
The Step Over button steps you onto the next instruction. Stepping over a subroutine call runs it at full speed and halts execution of the stepped thread at the next function or statement.
Run to Cursor (F12) Button
The Run to Cursor button places a temporary breakpoint at the highlighted line of source code. If the Source Debugger has halted execution of a thread and that break is highlighted in the Breakpoints tab of the Action window, that thread’s execution will be resumed at full speed. The Run to Cursor button can be used like a shortcut that will run from a breakpoint to wherever the highlighted line of code is situated.
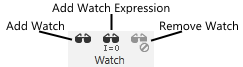
Add Watch (Ctrl + W) Button
Add the selected variable and its value from the module content window to the selected tab in the watch window.
See: Setting a Watch on a Variable
Add Watch Expression Button
Add the selected expression from the module content window to the selected tab in the watch window.
See: Set Data Breakpoints
Remove Watch (Del)
Remove the selected variable and its value from the watch window.
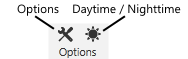
Set several options that affect the way the Source Debugger appears and behaves.
Daytime/Nighttime
Toggles the background between white (daytime) and black (nighttime) mode. The foreground (text) color will be the reverse.
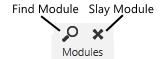
Find Module
Enter a Boolean expression and search to find all instances of the current module.
See: Search for a Specific Module Instance
Slay
Terminate the execution of the selected module instance.
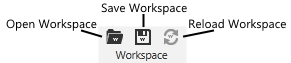
Open Workspace
A workspace is the set of the selected module, the breakpoints, and the watches for a Source Debugger session, stored in a .DWS file. Use this button to re-open a workspace that you have saved with the Save Workspace button.
Save Workspace
See preceding description for Open Workspace. Use this button to save the breakpoints and watches, and the selected module that you are working with, from one session to another.
Reload Auto Workspace
If you have enabled the automatic workspace reload feature (done in the Options dialog - see: Source Debugger Options) then you may use this button to load the last automatically-saved workspace.
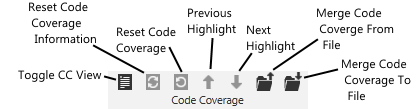
Toggle Code Coverage
Toggles the display of code coverage (the indicator of what modules, states, statements and parameters used)
Reset Code Coverage Information
Resets the code coverage counters to zero.
Refresh Code Coverage
Displays an up-to-date view of the code coverage.
Previous Highlight
Steps through the display to the previous statement (parameter…) highlighted as having been used by the module.
Next Highlight
Steps through the display to the next statement (parameter…) highlighted as having been used by the module.
Merge Code Coverage From File
Loads the code coverage record as stored in a file, into the current display. This is especially useful for team debugging where various team members are testing different parts of the code and wish to merge their results.
Merge Code Coverage To File
Saves the code coverage, from the current session to a file. This is especially useful for team debugging where various team members are testing different parts of the code and wish to merge their results.
 To the far right of the Source Debugger's tool bar is the mouse coordinates section. As you move your mouse pointer around on the screen, it reports the X and Y coordinates with respect to the origin of the VTScada window that the mouse pointer is over.
 This small "x" at the right-most edge of the toolbar will close the selected window in the Code Display area.
